Regression-Response Workspacewith a governed silicon autopilot inside
dVI is the place a verification team opens after a regression finishes to see what broke, what matters first, what should happen next, who owns the next step, and what evidence or history supports the decision. Autopilot runs inside that workspace as the governed execution layer, with provider-agnostic, cost-efficient intelligence designed for faster regression closure.
Focused evaluation on a painful regression family
Start with one live regression family and measure incident compression, response clarity, workflow reuse, and visible spend posture in your own environment.
What workspace means in practice
The workspace explains the product. Autopilot explains how it advances.
dVI is built for the work after a regression finishes: compressing noise, selecting the next move, preserving the result as reusable team memory, and keeping ongoing usage practical.
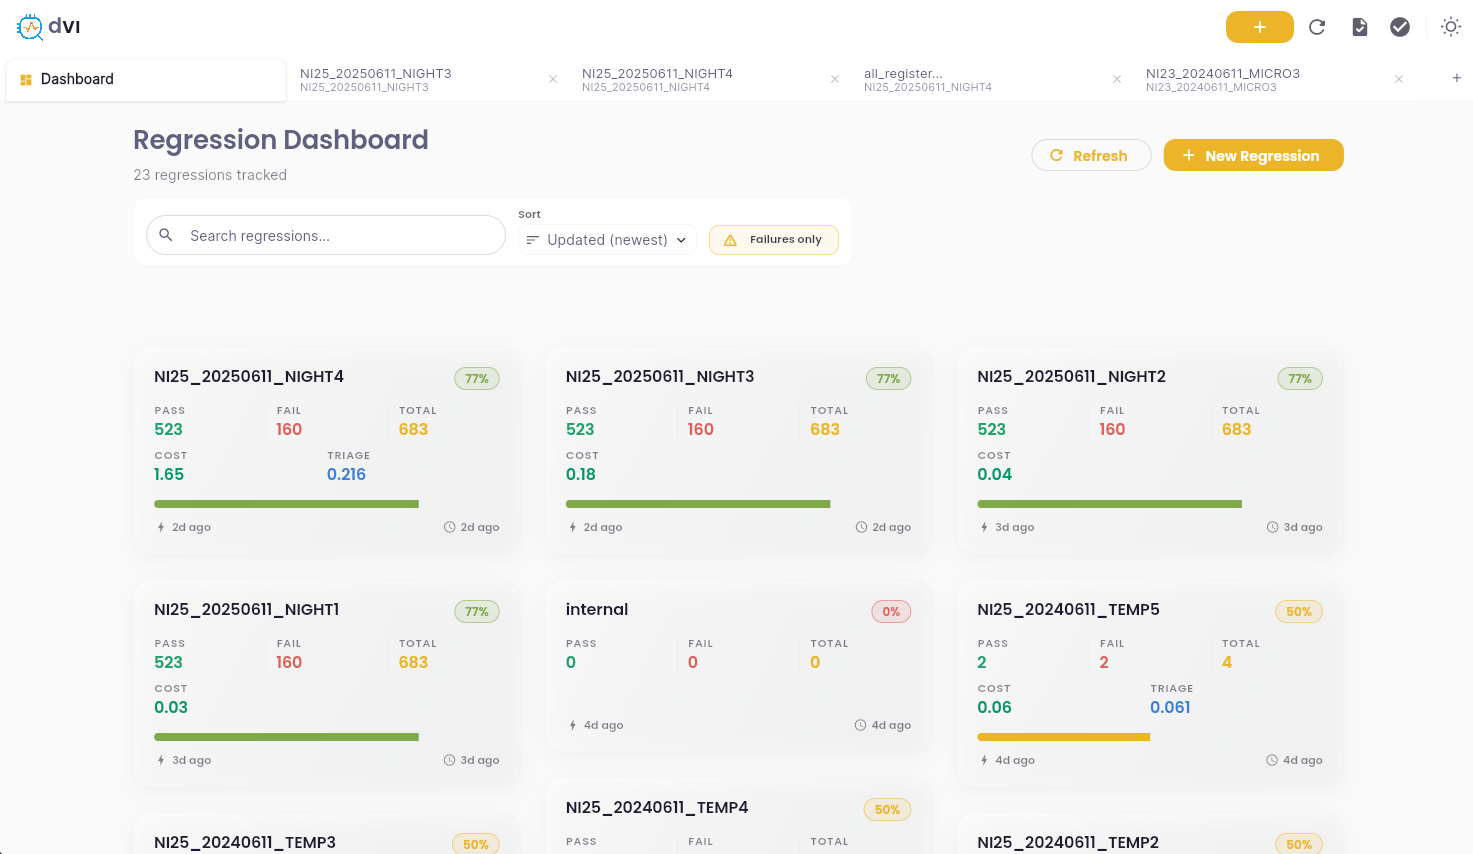
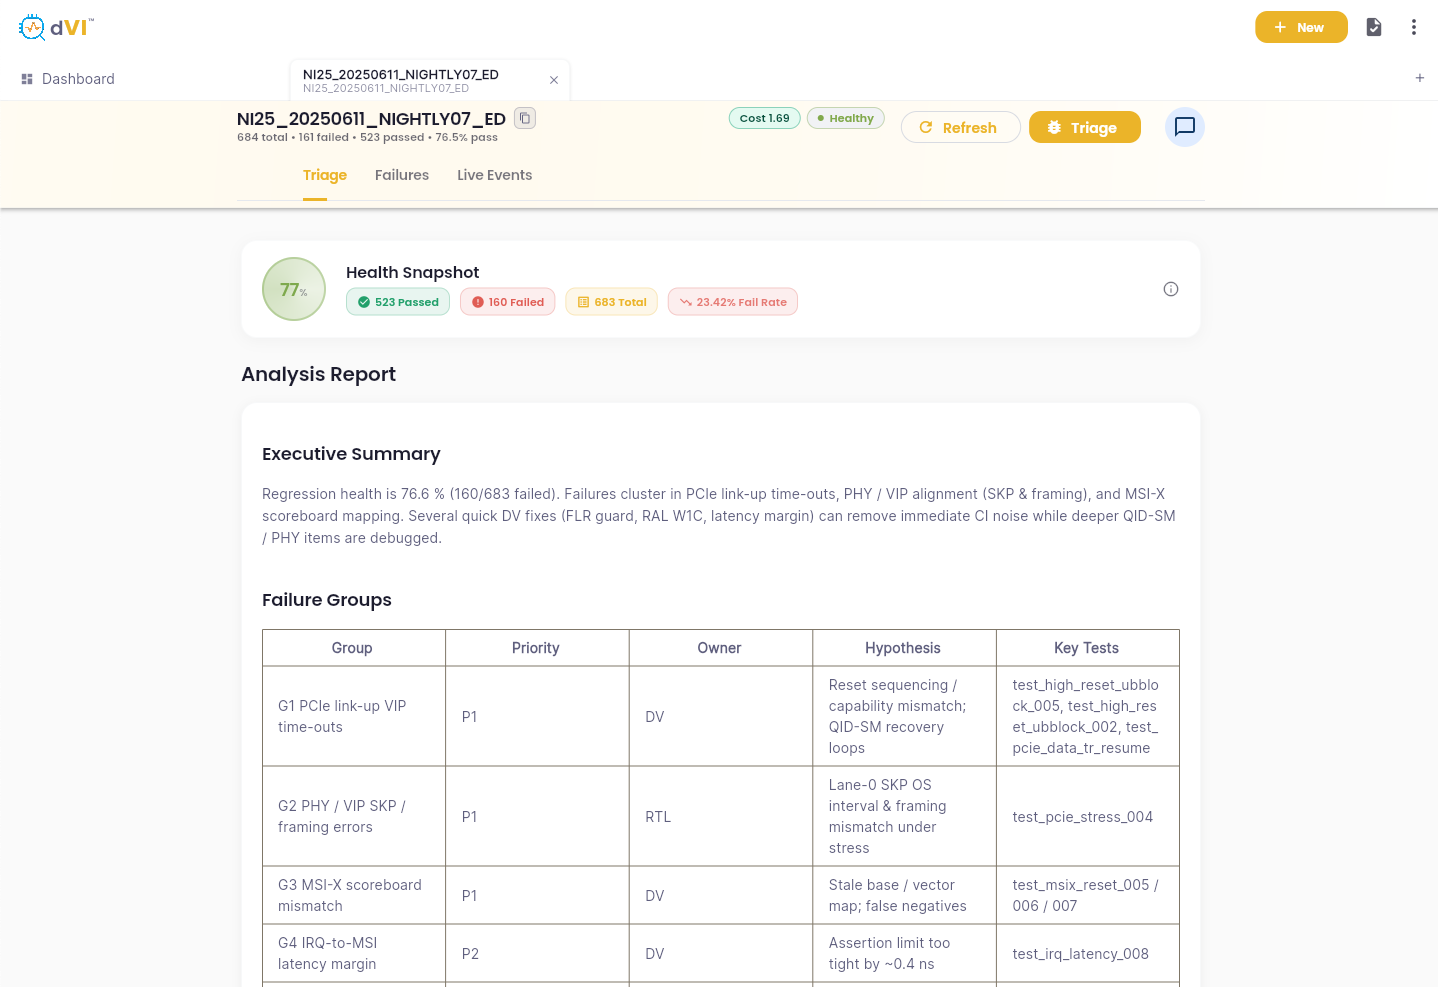
The workspace brings incidents, representative evidence, ownership, and current action state into one working surface.
That is what workspace means in dVI: one place to see what broke, what matters first, and what should happen next.
Policy-bounded workflows can rerun analysis, prepare follow-up, and keep action state visible without hiding the decision path.
Autopilot is how the workspace moves work forward, not a replacement for engineering judgment.
The model-backed stages are designed to stay cost-efficient, usage-aware, and easy to inspect across repeated regressions.
Teams can choose the provider that fits their environment and still keep the workflow practical for ongoing closure work.
Policy, Privacy, And Audit
- Customer-hosted deployment keeps logs, RTL, and artifacts inside your environment.
- Autopilot actions follow policy, identity, approval, and audit posture instead of raw model access.
- Selected evidence, workflow history, and usage stay attached as durable records.
Runs Above The Stack You Already Have
dVI starts after regression data exists. It does not replace your simulator, scheduler, farm, CI flow, tracker, or debug tools. It gives those systems a governed response layer.
Workspace capabilities
What the workspace actually means
The workspace is not another dashboard. It is the operating surface where incident review, bounded autopilot, coverage closure work, saved evidence, and practical model usage stay connected.
- Workspace for the morning review
- Published incidents, representative evidence, continuity, and action state replace a flat failure pile.
- Governed autopilot follow-through
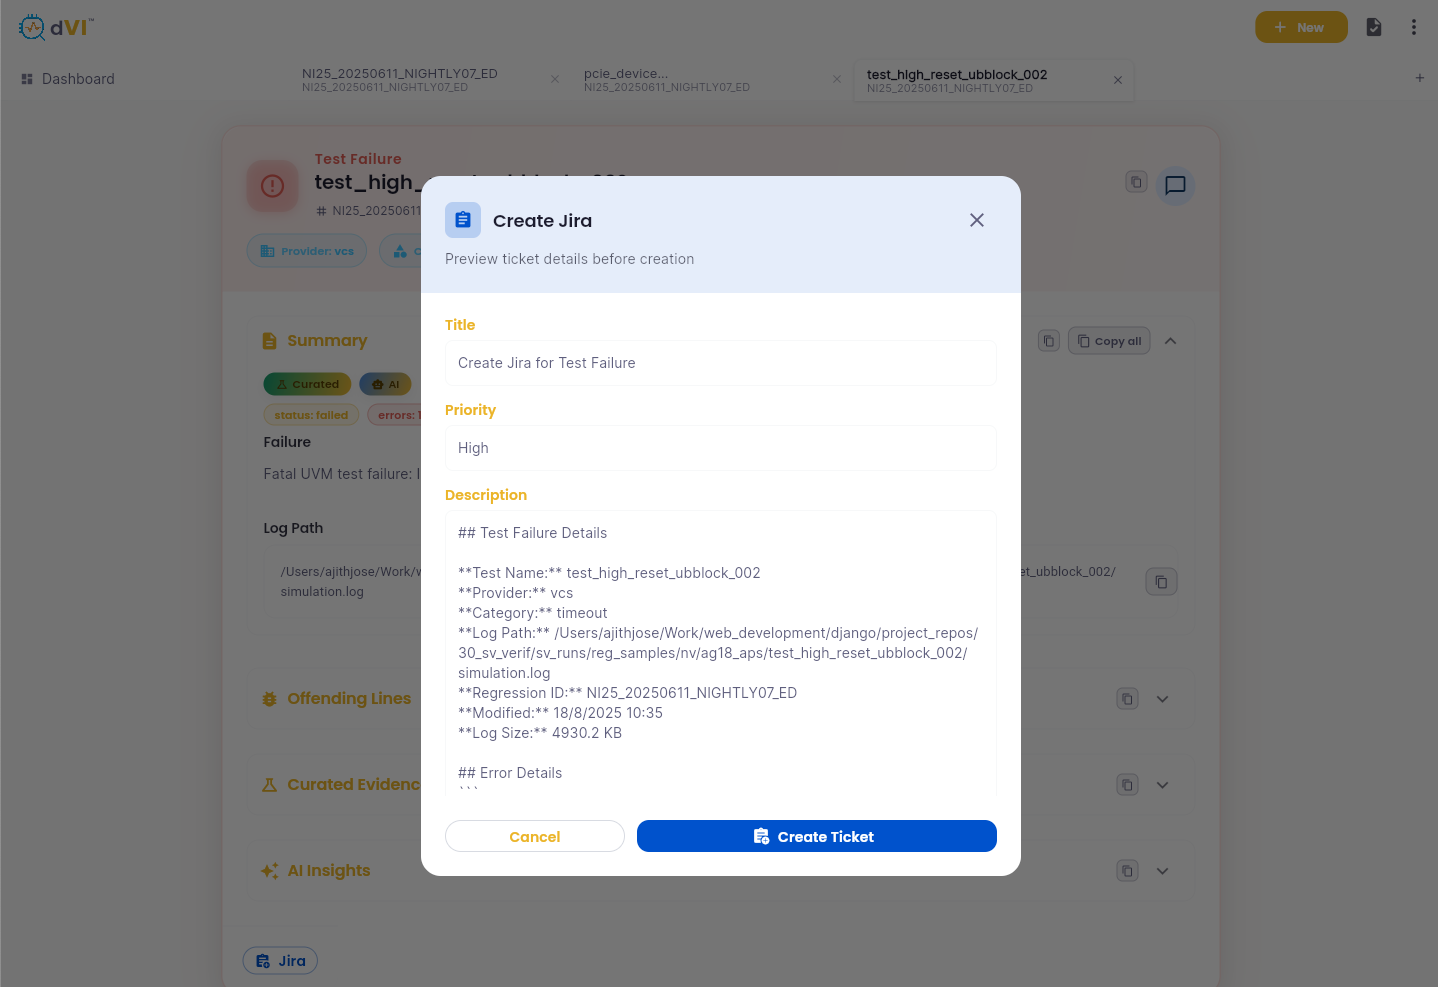
- Autopilot can rerun analysis, select bounded follow-up, and preserve attempts, approvals, and outcomes under policy.
- Coverage lane when enabled
- Prepared coverage data becomes grouped closure work and prioritized focus areas alongside the same regression record.
- DeepDebug™ for representative evidence
- Target the incidents that matter most with grounded investigation instead of debugging every failing test.
- Provider-agnostic, cost-efficient intelligence
- Choose the model provider that fits your environment while keeping repeated workflow runs practical and inspectable.
- On‑prem and stack-friendly
- Keep logs, RTL, and artifacts inside your environment while fitting existing simulators, schedulers, and surrounding flows.
Durable product truth
What the workspace preserves
dVI keeps the response attached to the regression so the next engineer, the next rerun, and the next recurrence all start ahead.
Start from one working surface
Morning review opens on compressed incidents, representative tests, ownership, and the current action picture instead of a flat wall of failures.
Keep evidence, workflow history, and usage in view
Saved evidence trails, attempts, approvals, and usage stay attached instead of disappearing into chat or ad hoc notes.
Reuse memory on the next regression
Known history, accepted outcomes, and continuity help future runs start with context instead of rebuilding it from scratch.
Why dVI over chat, scripts, and spreadsheets
The difference is not only better analysis. It is a workflow-managed product that keeps evidence, actions, approvals, usage, and history in one durable system.
Advantages
- Reviewable incidents and an optional coverage closure lane, not just raw summaries
- Rerunnable checkpoints instead of starting every analysis session from zero
- Current action decisions, attempts, and approval posture per incident
- Saved evidence trails and reusable cross-run memory
- Provider-agnostic model stages with practical usage and clear spend visibility
- Same product truth across UI, CLI, API, and MCP surfaces
- Bounded actions under policy instead of unchecked agent behavior
Direct answers
Questions AI search and verification teams ask about dVI
Short, citation-ready answers for teams evaluating whether dVI fits their regression response workflow.
- What is dVI?
- dVI (Dhenara Verification Intelligence) is a regression-response workspace for silicon verification teams. It is the place the team opens after a regression finishes to review what broke, what matters first, what should happen next, who owns the next step, and what evidence supports the decision.
- How does autopilot fit into dVI?
- Autopilot is the governed workflow layer inside dVI. It advances regression response through rerunnable, policy-bounded workflows and keeps attempts, approvals, outcomes, and usage visible.
- Is dVI just a log chatbot?
- No. Chat is only one optional surface. The product is the workflow-managed system around the answer: incidents, coverage data, action state, approvals, audit, usage visibility, and reusable team memory.
- How is dVI different from scripts, dashboards, or regression managers?
- dVI is not a replacement for the simulator, scheduler, farm, CI flow, or ticket tracker. It sits above the existing regression stack and gives teams a governed response workspace with durable evidence, actions, coverage work, and rerunnable follow-through.
- Does dVI run on-premises?
- Yes. dVI is designed to run fully on-prem with zero data exposure. Your logs, RTL, testbenches, and proprietary artifacts stay inside your environment.
- Which simulators and languages are supported?
- dVI is designed for common verification environments including Synopsys VCS, Cadence Xcelium, Siemens Questa, and Verilator, with SystemVerilog, UVM, Verilog, VHDL, and adjacent EDA artifacts handled during deployment.
- What is DeepDebug?
- DeepDebug is the focused investigation path for representative incidents. It follows curated evidence toward likely root-cause paths and keeps the output attached to the broader incident and workflow record.
- Is dVI provider-agnostic?
- Yes. dVI is designed to work with the model provider that fits the customer environment and policy posture while keeping repeated workflow use practical and inspectable.
- What should a 4-6 week dVI evaluation measure?
- A focused evaluation should measure time to first useful action, incident compression quality, coverage closure usefulness, repeatability across reruns, workflow reuse, evidence quality, and practical ongoing model usage.
- How do we start a pilot?
- Dhenara runs focused 4-6 week on-prem evaluations with setup support and agreed success metrics. Teams can book a working session at https://calendly.com/dhenara/dvi.